About BrSM Initiative - Conceptual approach
Conceptual approach
BrSM offers an expansion to the current medical approach that broadens the clinical toolbox. The realization of the fundamental interconnectedness of biological networks and their role in health and disease is essential to addressing disease comprehensively.
The purpose of the model development was to realize and articulate the relationships among the scientific and clinical elements of BrSM in a way that can trigger and sustain a novel, patient-centric practice transformation, and in turn lead to improvement in patient outcomes.
Developing the Bioregulatory Systems Medicine model
In 2008, Heel convened the initial model development meeting with independent medical and scientific experts, in collaboration with experts in bioregulatory medicine from Heel. Four follow-up expert group round tables were conducted over the subsequent three years.
The objectives of these round tables were iterative inquiry of empirical experience in clinical practice, highlighting unmet medical needs and gaps in the current treatment paradigm. Meetings also included discussions and feedback on the latest trends in modern biomedicine, considering them through the lens of available preclinical and clinical research.
The outcome was an initial set of scientific and clinical topics as the basis for a data mining strategy. Topics included molecular biology, systems biology, systems medicine, P4 medicine, inflammation resolution, immunology, neuroscience, genomics, integrative medicine, chronic non-communicable diseases, multimorbidity and iatrogenesis. Particular emphasis was placed on systems biology and systems medicine as a modern science for explaining the complexity of human biology and disease.
Following these meetings, discussion content was summarized and a preliminary framework of the BrSM concept was developed.
The development process diagram is depicted in the figure below. Additional details are described in the White Paper.
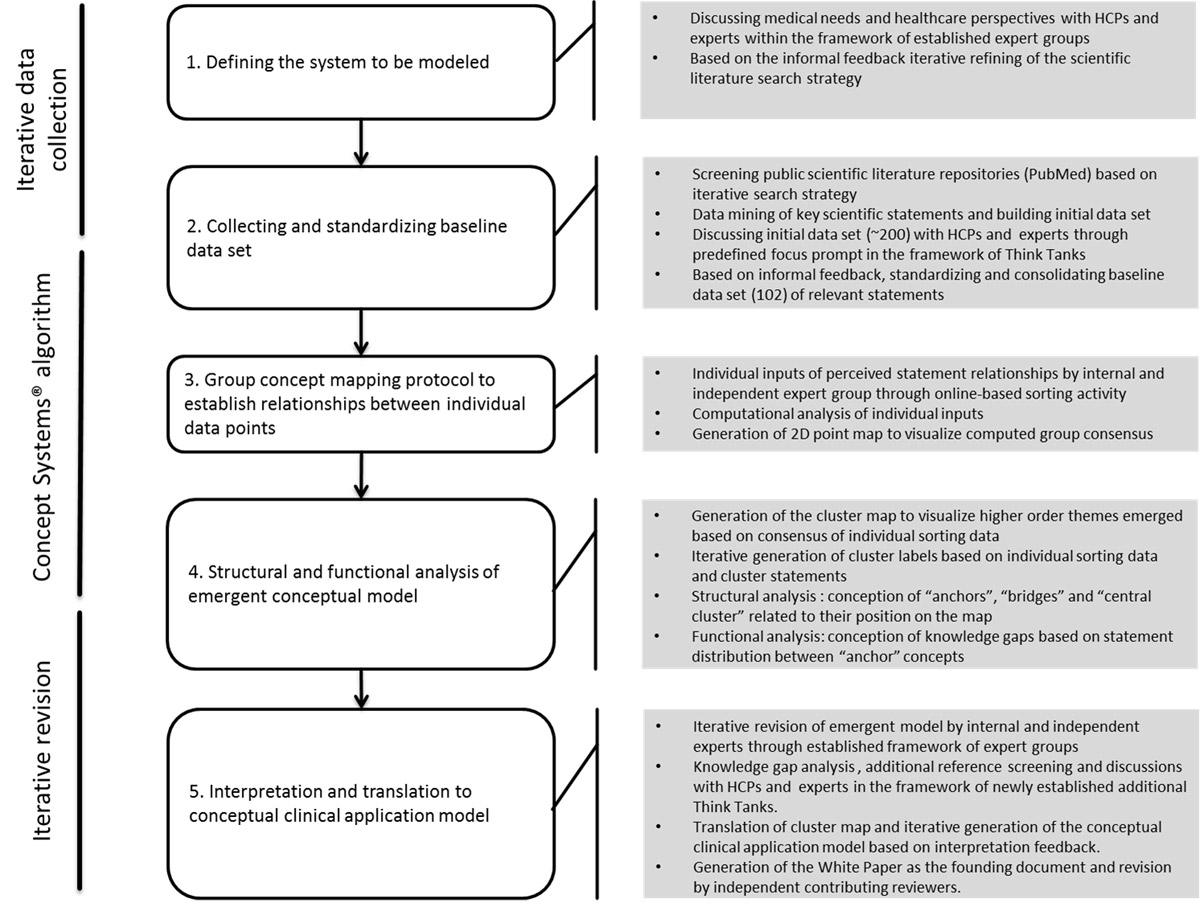
The key steps in the process iteratively engaged HCPs and independent scientific experts by establishing the framework of expert group round tables, inquiring for feedback in almost each step, and using The Concept System© conceptualization algorithm to compute and visualize emergent consensus from a larger group of participants. The emergent conceptual model serves as a basis for research program development and further experimental validation.
Group Concept Mapping
Based on a group concept mapping process, individual inputs were analyzed in order to establish relationships among the items drafted from literature review and expert meetings.
- A two-dimensional point map was generated to visualize emergent group consensus.
- Based on structural and functional analysis, a cluster map was developed to visualize higher order themes.
- Conceptual patterns revealed how the content is distributed across the two-dimensional model representation. Experts examined the model, identifying four anchor clusters.
For a detailed explanation of group concept mapping analysis, please refer to the White Paper.
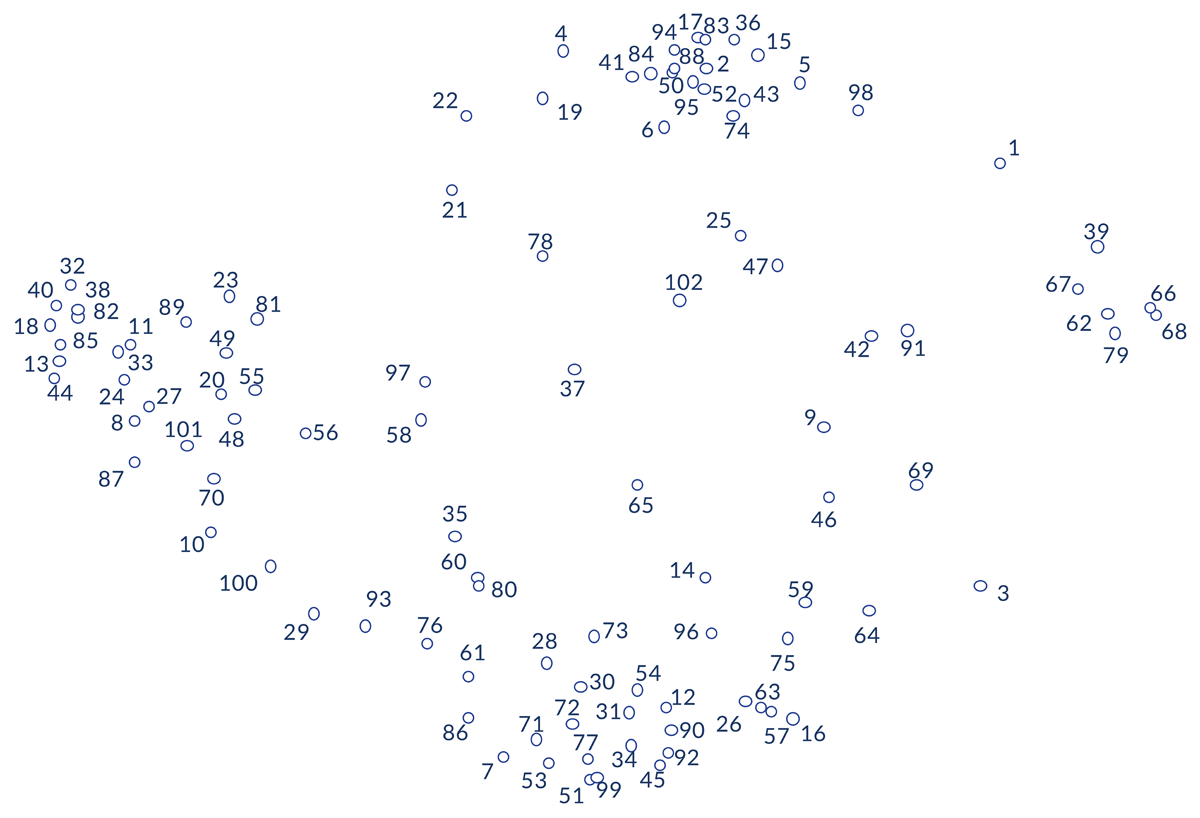
Each point in the figure represents one of the 102 statements derived through extensive literature mining and expert consensus, and considered to represent a key component of the Bioregulatory Systems Medicine conceptual model. Items number from 1 to 102, and each item number was assigned randomly for ease of reference. Statements that appear closer to one another on the point map tend to be thought of as more conceptually similar by those who participated; statements that appear farther apart tend to be thought of as more conceptually distinct.
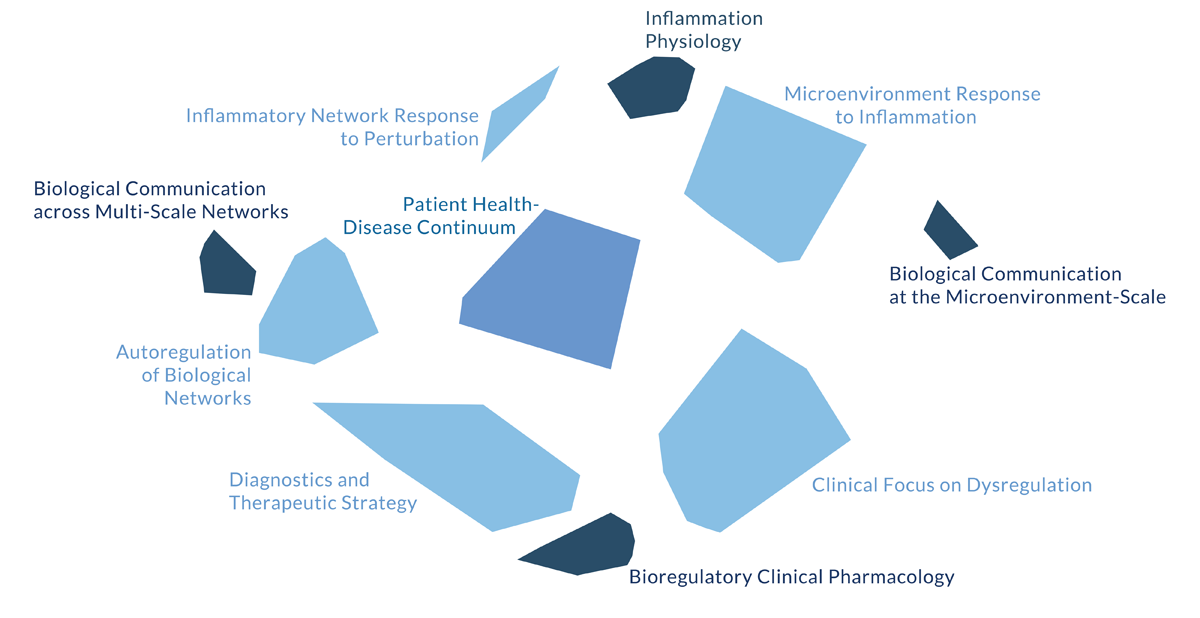
The labels assigned to each cluster reflect the shared higher-order themes that describe the more specific statements within each cluster and in a way that conveys its meaning in the context of the Bioregulatory Systems Medicine paradigm. Cluster labels were derived and finalized by the authors and contributing reviewers that championed the model development initiative.
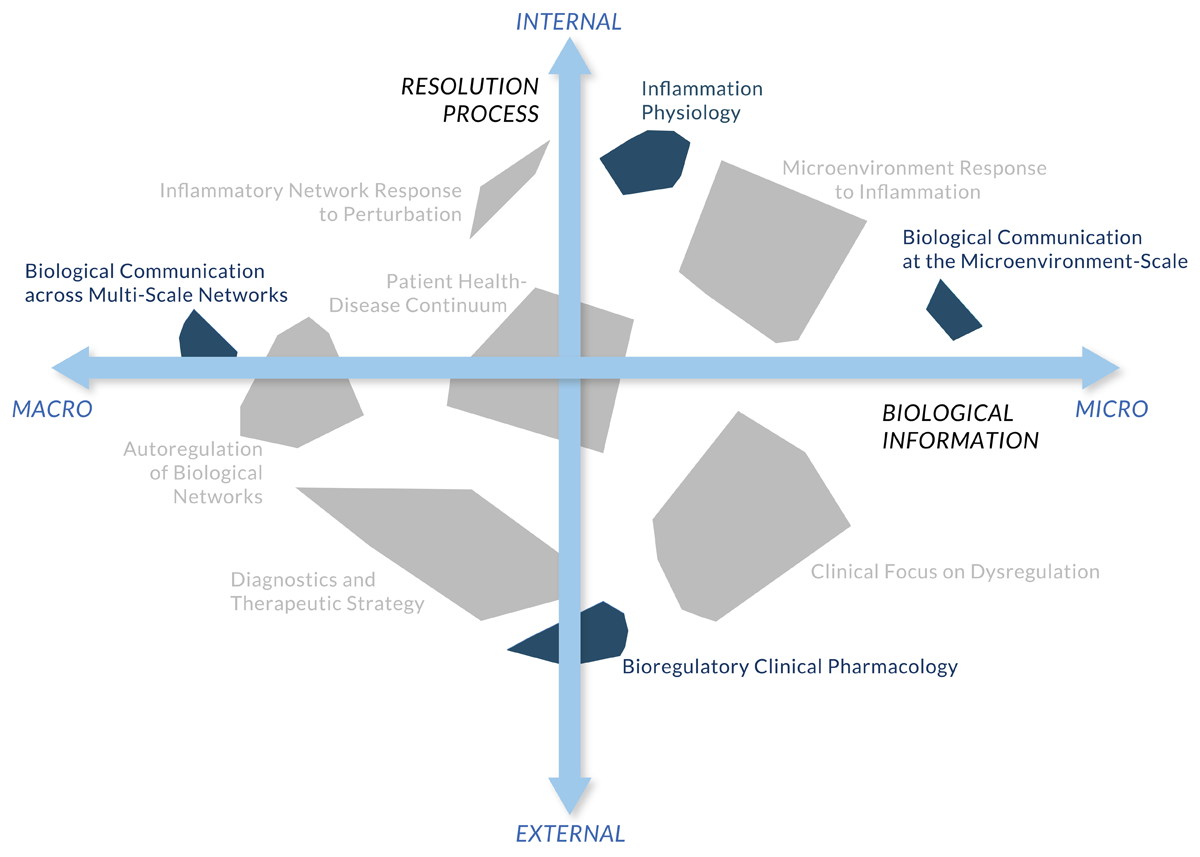
The figure illustrates the conceptual dimensions and anchors of the model that emerge from the group concept mapping process, analysis, and interpretation of the interrelationships among the clusters. The dimension that appears vertically in this figure is labeled "Resolution Processes," as the content along this axis relates to participants' conceptualization of disease resolution occurring through both internal and external mechanisms. The horizontal dimension is labeled “Biological Information," along which the content relates to communication within and across micro and macro levels of biological organization. Intermediate and central clusters are displayed in gray to contrast their location along the dimensions and with respect to the anchor clusters (dark blue).
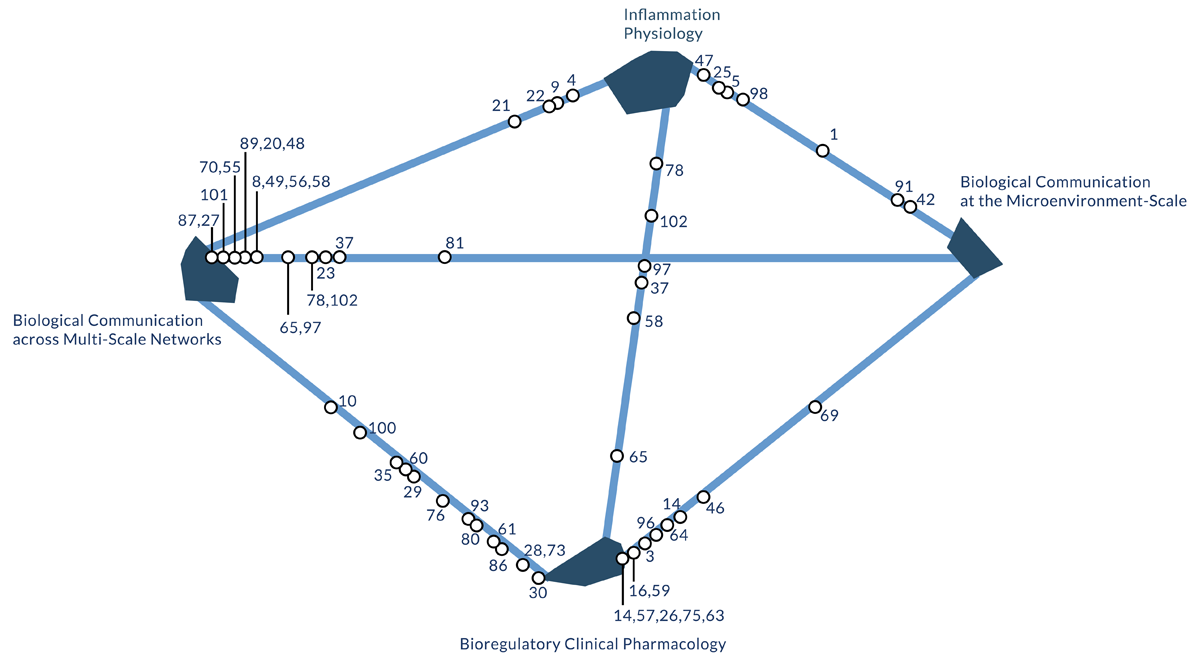
The intermediary clusters are those that are spatially located between the anchor clusters, and can be described as conceptual bridges that strongly relate to their respective neighboring anchors. The figure illustrates the statements of each intermediary cluster as arranged between each cluster’s corresponding anchors. A statement’s distance from either anchor reflects the relative strength of relatedness that participants collectively perceived among that particular statement and the neighboring anchors. The degree to which the space (blue line) between each anchor is relatively evenly populated with statements may suggest the extent to which the intermediary cluster effectively functions as a conceptual bridge between the anchors.